
AdjustedCostBase.ca now offers a streamlined method for importing phantom distribution and return of capital transactions for many exchange traded funds (ETF’s), publicly traded mutual funds, income trusts and real estate investment trusts (REITs). Learn more about this feature.
When you own exchange traded funds (ETF’s), trusts, or other kinds of publicly traded funds, your brokerage should provide with a T3 slip every year showing the tax breakdown of the distributions that were paid out. The information contained on the T3 slip is vital for completing your tax return as well as for updating your adjusted cost base balances.
However, it may not always be prudent or rely on your brokerage to send you this information for the following reasons:
- If you own multiple funds your brokerage may send you a single T3 slip covering all distributions for all the funds. This is problematic because your adjusted cost base needs to be calculated separately for each security you own. For example, if you’ve received distributions in the form of return of capital, you need to know the allocation of return of capital for each security for adjusted cost base to be correctly calculated.
- On occasion incorrect information may be reported on a T3 slip.
- T3 slips can get sent out very late in the tax season. They are only required to be sent out by March 31st. Many brokerage will wait until this deadline to mail them out even if the necessary information is available before then.
- Non cash distributions (also known as reinvested capital gain distributions or a phantom distribution”) are not specified on T3 slips. Not factoring this information into your ACB calculations will result in too much tax being paid.
A solution to these issues is to access an online service provided by CDS Innovations Inc. They provide the tax breakdown of all Canadian public mutual funds and limited partnerships. This includes all ETF’s and income trusts. The data is provided in the form of Excel spreadsheets that list the breakdown of the distributions per unit. By using this service you’ll usually be able to access the information sooner (most funds/trusts will release their tax breakdown information before the end of February) and ensure that everything is accurately recorded.
Tax breakdowns are usually provided by ETF providers and trusts on their web sites. However, this information can be difficult and cumbersome to track down. CDS Innovations Inc. provides everything in one place.
The tax breakdown service from CDS Innovations Inc. can be accessed here:
2025 and beyond: CDS Innovations Inc. Tax Breakdown Posting
2024 and earlier: CDS Innovations Inc. Tax Breakdown Posting
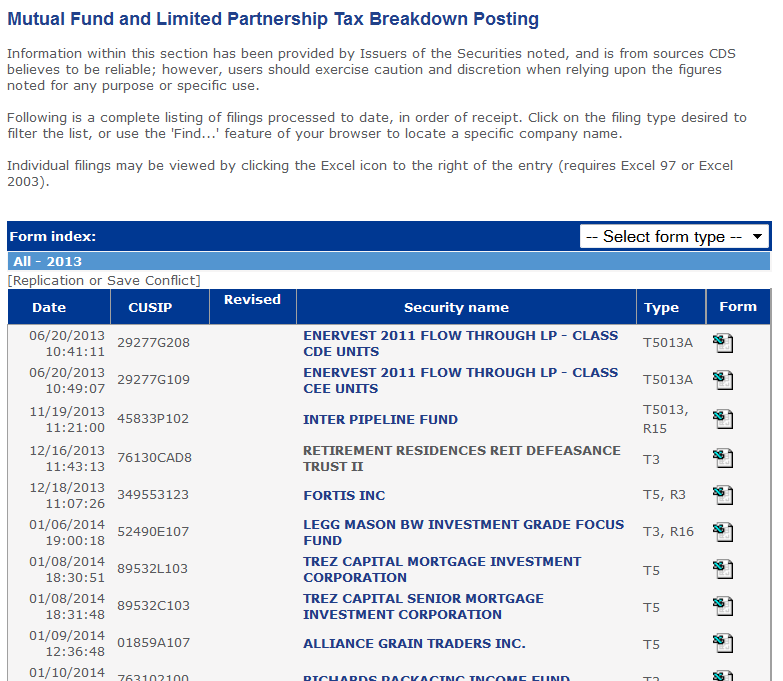
Unfortunately the securities are not listed by ticker symbol so it can sometimes be hard to find the one you’re looking for. To access the data click on the Microsoft Excel file icon in the “Form” column.
As an example, let’s look at the T3 tax form for XDV (“ISHARES DOW JONES CANADA SELECT DIVIDEND INDEX FUND”) for 2013. When you first open it up in Microsoft Excel, you may see the following warning about enabling macros:
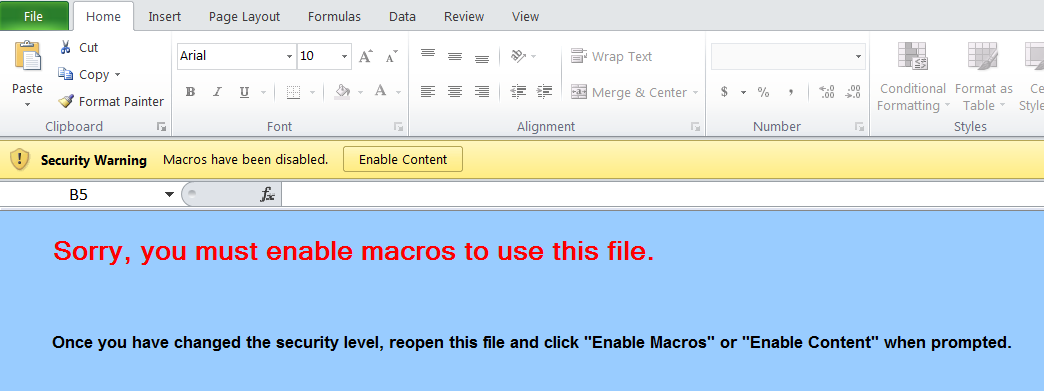
You will need to click on the “Enable Content” button to enable macros (the file is from a trusted source). After macros are enabled you should see the following:
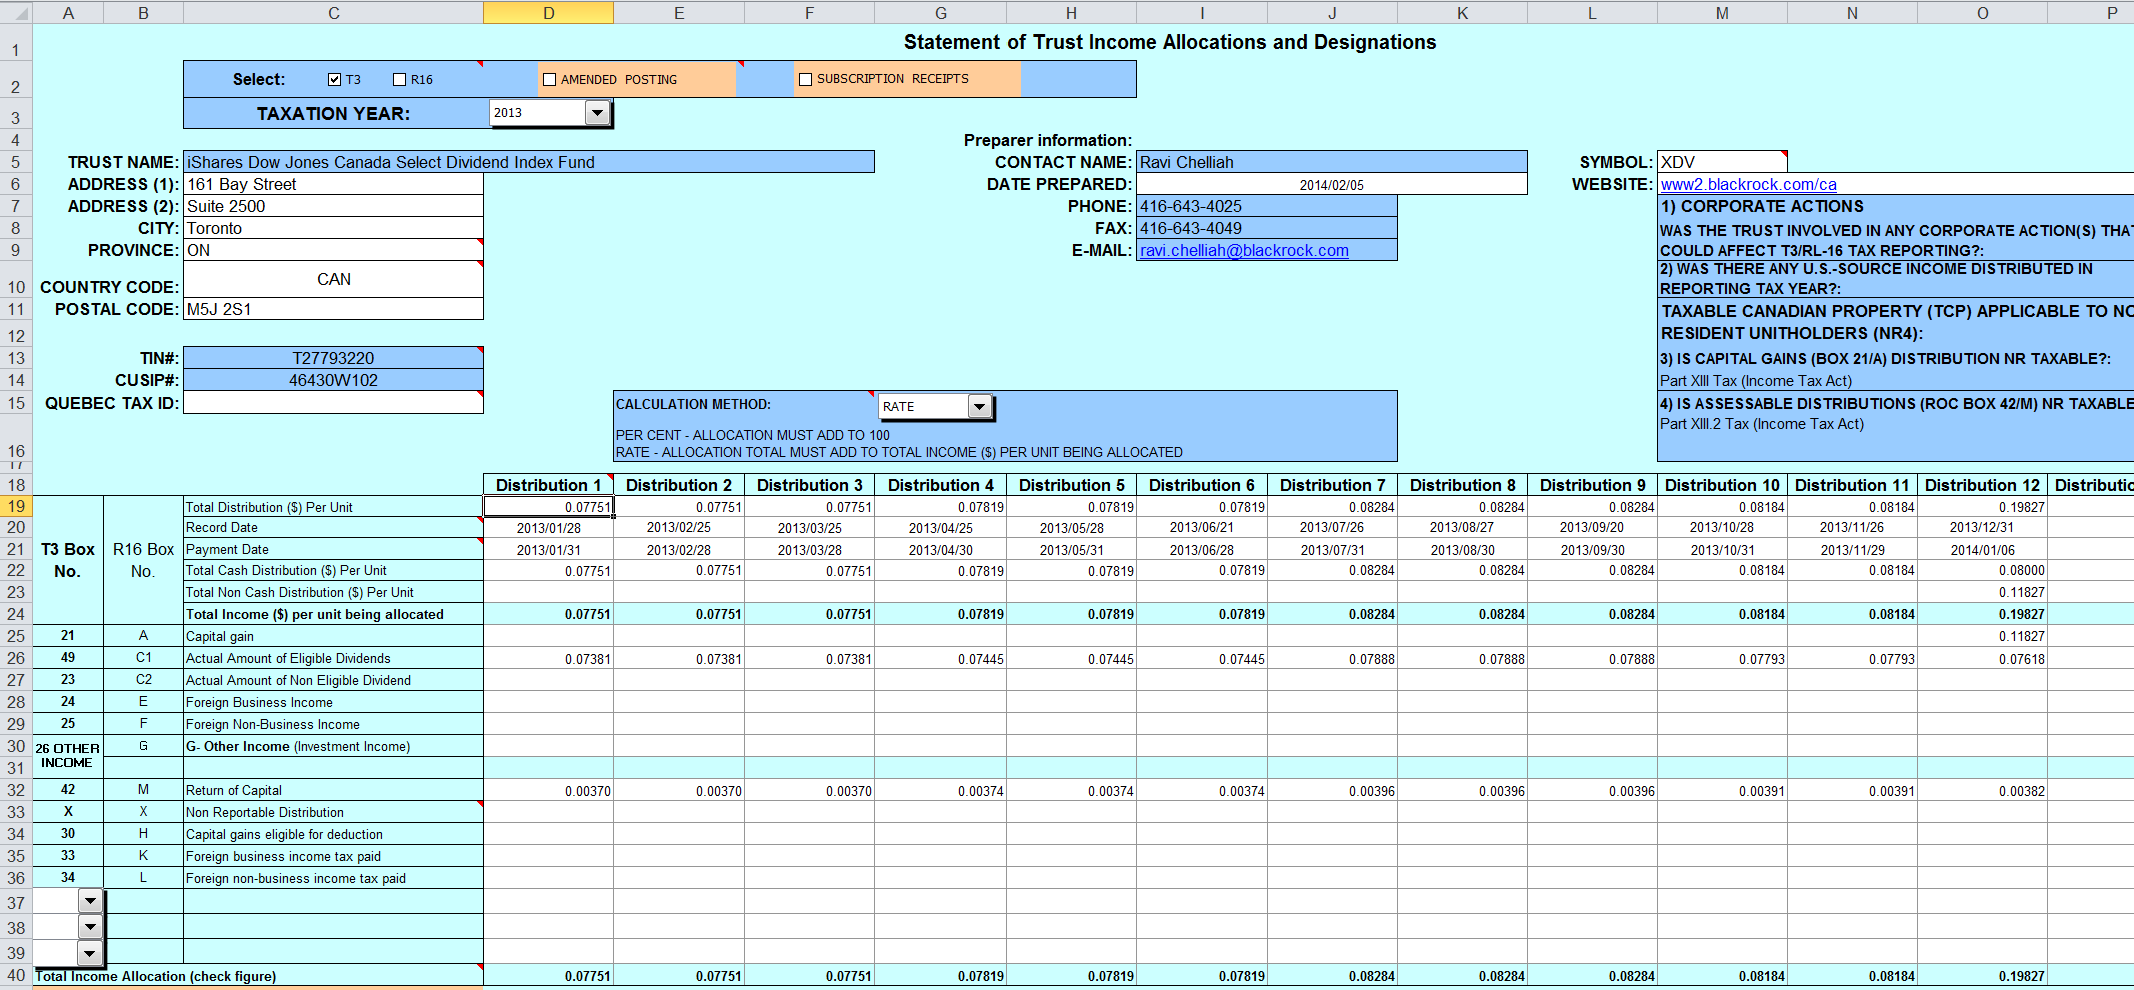
This forms shows the tax breakdown of the distributions for XDV for 2013 broken down for each distribution. Many of the rows, such as Actual Amount of Eligible Dividends (49) and Foreign Business Income (24) are immediately taxable for the current year and must be reported on your tax return.
The following rows are relevant towards tracking your ACB and reporting capital gains:
- Total Non Cash Distribution ($) Per Unit
- Capital gain (21)
- Return of Capital (42)
The “Total Non Cash Distribution ($) Per Unit” is a distribution that has not been distributed as a cash dividend. Rather, it has been reinvested in the fund. This is also known as a “Reinvested Capital Gains Distribution” or a “Phantom Distribution” (since the funds are reinvested but the unitholders do not receive any additional units). These amounts should be added to your ACB. Since this type of distribution results in an increase in ACB, it has the effect of reducing your capital gain when the units are eventually sold. So if you ignore these distributions, you’ll end up paying more capital gains tax than you need to. The amount is shown as a per unit value, so you’ll need to multiply it by the number of units you own. Non cash distributions are often paired with a capital gains distribution of equal value.
A “Capital gain” distribution occurs when a dividend is paid out but it’s taxed as a capital gain. This can occur when a fund sells holdings, resulting in a capital gain, and this capital gain is distributed to unit holders. The capital gain must be reported on your current year’s tax return (it should appear in box 21 of your T3 slip). A capital gain distribution does not affect ACB.
Finally, a “Return of Capital” distribution is cash that’s returned to unit holders but isn’t immediately taxable. ACB should be reduced by the amount of the return of capital distribution. Since ACB is reduced, this has the effect of increasing your capital gain once the units are eventually sold. If you fail to account for a return of capital distribution, you’ll be evading taxes.
The distributions for the year are each listed separately. For the case of XDV in 2013, there were 12 monthly distributions. If you made no purchases or sales of XDV for the year (i.e., the number of units owned as constant throughout the year) you can simply sum up the total annual amounts for each row. Otherwise, you should calculate each month separately. Pay close attention to the “Record Date” row for each distribution. Each distribution applies to a unit if and only if the unit was owned on the “Record Date.”
AdjustedCostBase.ca supports the tracking of ACB and capital gains for the distribution types mentioned above. Below is an example of how to enter the distribution for December 31, 2013 (distribution #12):
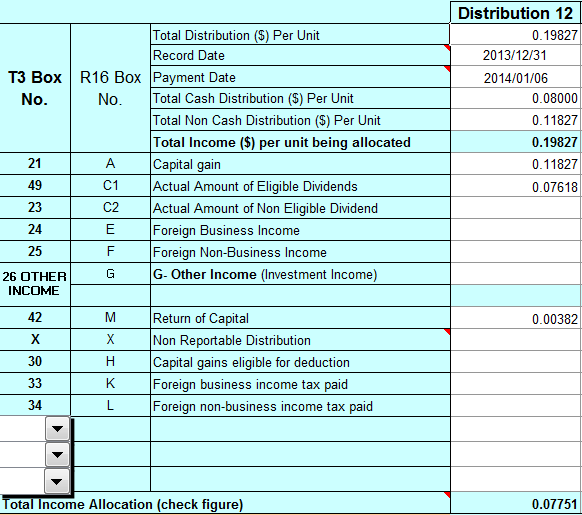
In this case the distribution contains a capital gain and an eligible dividend distribution. These would appear on the T3 slip you receive from your brokerage and would be included in your tax return for the current year. The distribution also has a non cash component and a return of capital component.
Let’s assume that 1,100 shares of XDV are owned on the record date of December 31, 2013, with a total ACB of $27,570.
The “Total Non Cash Distribution ($) Per Unit” and “Capital gain” components can be entered jointly as a “Reinvested Capital Gains Distribution” transaction as follows:
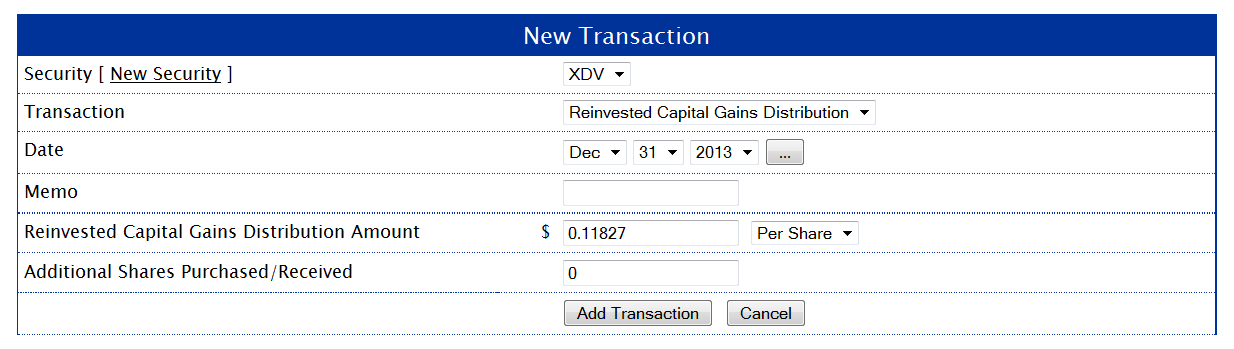
Since no new units were issued, enter 0 for the “Additional Shares Purchased/Received” field. The distribution amount is specified as $0.11827 as shown on the T3 form from CDSInnovations.ca. This has the affect of increasing the total ACB by:
  1,100 units x $0.11827/unit
= $130.10
Next, the “Return of Capital” transaction must be accounted for as a “Return of Capital” transaction type:
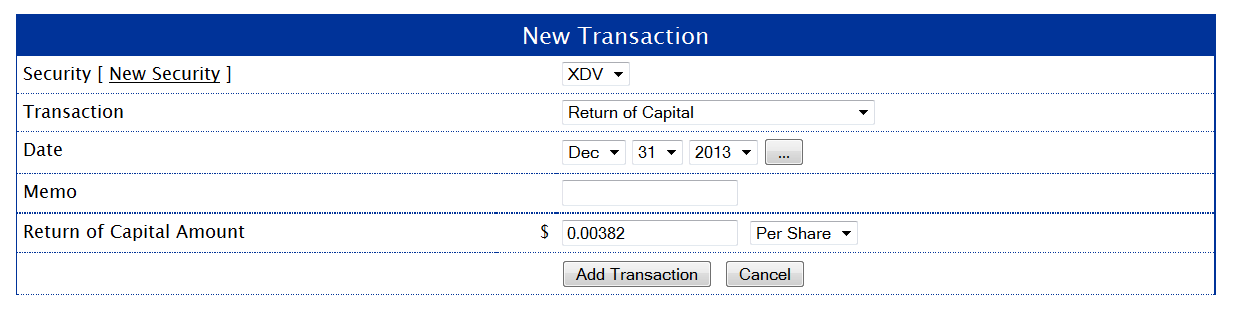
The amount is entered as $0.00382 per share as shown on the T3 form. This has the affect of decreasing the total ACB by:
  1,100 units x $0.00382/unit
= $4.20
You must also account for the other 11 transactions for the year, although the rest of the transactions do not have a non-cash or capital gain component.
Let’s assume that the following purchases were made for XDV:
- Initially buy 1,000 shares for $25.00 on January 2, 2013 with a $10 commission.
- Buy 100 shares for $25.50 on July 10, 2013 with a $10 commission.
The complete list of transactions for XDV for 2013 would appear on AdjustedCostBase.ca as follows after entering all 12 distributions:
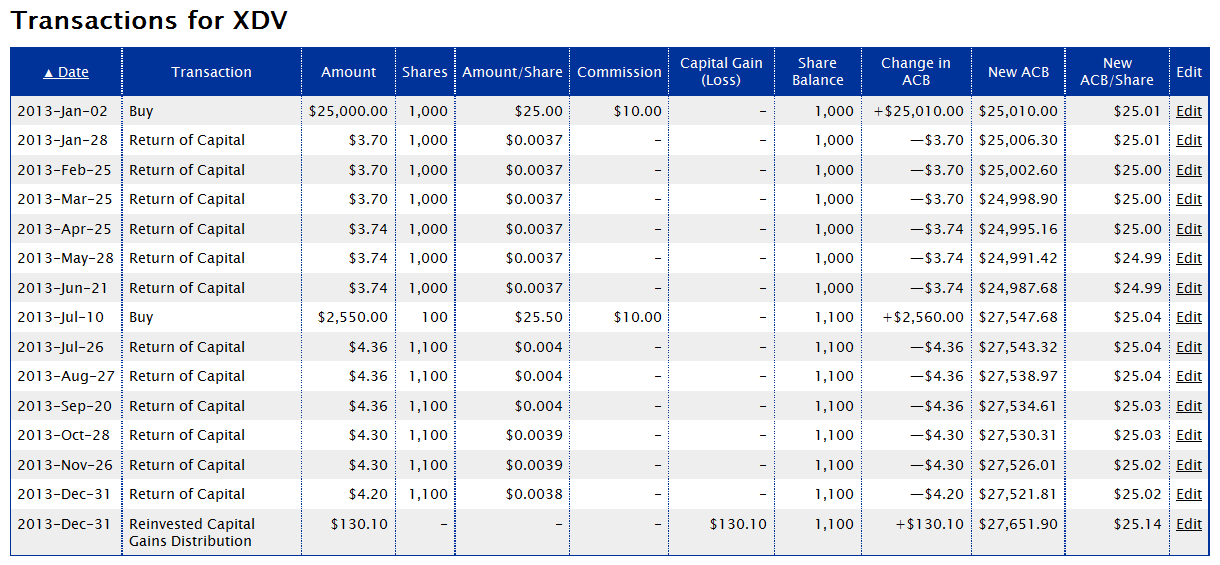
If the number of units owned was constant throughout the year, we could have combined the 12 return of capital transactions into one. Since the number of units was constant for the first 6 return of capital transactions they could be combined into one (ditto for the last 6).
Hi There, I’m so very close to the information / data I need! I’m a recent registrant to your web site’s helpful services & have just set up my portfolio. I thought I’d explore the CDS Innovations tax breakdown services to verify if I have captured all of the Return of Capital, Capital Gain, and Total Non Cash Distributions per Unit for my few holdings and verify my own historic record keeping at the same time. (I’m attempting to check to see how accurate my record keeping & reporting has been since the 2014 & 2015 tax year, just ahead of this year’s 2016 tax year deadline.). Your helpful introduction to the CDS Web site and it’s downloadable data is very good. However, I’ve encountered a technical hurdle that I’m hoping you may have some insight or may have been alerted to by any other users. For instance, when I access the investment’s 2014 T3 (same issue for other years), I open up the spreadsheet (as indicated above). However, I’ve noticed that the spreadsheet will not update when I change the Calculation Method from PERCENT (which is the default upon initially opening the spreadsheet) to RATE. This is, of course, even after enabling macros. I’m using Microsoft Excel 2007 and have noted that CDS Innovations indicates their template is compatible with Excel 97 and 2003 versions. I’ve even contacted CDS Innovations Support however, they instead refer me to the investment dealer for that particular investment (contact information on the spreadsheet). (The investment dealer supplies the data; however, the spreadsheet template reporting the data seems common to all of the investment dealers reporting their data to CDS Innovations so it would almost seem that the spreadsheet template is proprietary to CDS Innovations. I’m wondering if you have heard whether any other users have reported similar challenges and if there is a solution. Otherwise, I would likely have to look up each fund family separately. This would be a further challenge since recent tax years are available, however, previous tax years may require further follow-up with the investment dealer.
Spencer,
The PER CENT / RATE drop-down menu is intended for the accountants filling out the forms to use in order to indicate the nature of the values being inputted, rather that for readers of the data to toggle between dollar amounts and percentages.
Note that AdjustedCostBase.ca Premium provides a user-friendly means for you to access fund tax data and import it into your calculations:
https://www.adjustedcostbase.ca/blog/streamlined-import-of-return-of-capital-and-phantom-distributions-and-for-exchange-traded-funds-etfs-publicly-traded-mutual-funds-and-trusts/
Hi, is there a similar site that provides this information for US listed ETFs?
Emilia,
US-listed ETF’s should not generally make distributions that involve return of capital or phantom distributions. The distributions are normally taxable as foreign income no matter how the distribution might be categorized by US tax law.
Thanks. So, even if the US listed ETF has a return of capital portion in their distribution, is it taxed as income or capital gain?
Emilia,
It’s my understanding that income from a US-listed ETF is taxed as foreign income even if it’s considered to be the equivalent of ROC in the US (and there is also no reduction in ACB).
I am noticing for some funds, the actual distribution deposit as recorded by my online investment brokerage may be off by a penny or so, when comparing it to the statement my financial institution has provided that accompanied my T3 slip. Additionally, the CDS Tax Breakdown Data which lists the cash and non-cash distributions per unit / share is also slightly different sometimes by as much as $0.50 for the total distribution. I am wondering what do you prioritize as accurate data? I see that you mention that on occasion the T3 information may be inaccurate. Do you rely on the CSD Tax Breakdown Data exclusively, even though it differs from the observed deposit of funds? Please offer feedback.
AS,
The data on your T3 should not be inaccurate. It’s possible this could be a rounding error, but you could check with your brokerage to be sure. Note that the amount reported on your T3 should include the non-cash component in addition to the cash component of a distribution.
Hi:
Great website/product. How would one deal with a REIT, with, for example, “other income”?
Thanks
David,
“Other income” does not affect ACB. Only return and capital and phantom distributions affect ACB while capital gains distributions result in immediate capital gains for the current tax year. All other types of investment income have no effect on ACB (unless a distribution is reinvested).
Hi: Your site has been extremely helpful but as I’ve been logging historical transactions I’ve come across a confusing Return of Capital value for ZCN calendar year 2013. I’ve downloaded the T3 from the CDS site and the Return of Capital amount (Dec 30, 2013) is 17.3211 – I can’t imagine that this is a per share value? When I refer to the BMO site it indicates a Return of Capital value of 0.012680 for 2013 – this appears to me to be a more accurate per share value. Is it possible the CDS T3 info is incorrect for ZCN? Or am I totally missing something ..
George,
The distribution breakdown for ZCN for 2013 is reported in percentages of the total distribution amounts. The ROC amount for Dec. 30, 2013 is 17.3211% of the total distribution per unit of $0.07319, or $0.01268.
Hello,
In the example, is the 0.07618 eligible dividend distribution ignored because it is not relevant to ACB and capital gains? I.e. dividends are taxed as income and are therefore not relevant for ACB and capital gains calculations.
Also, to better my understanding od adjustedcostbase.ca, in your example you combine the “Total Non Cash Distribution ($) Per Unit” and “Capital gain” components as a single “Reinvested Capital Gains Distribution” transaction.
This implies, then, that I could enter those in adjustedcostbase.ca as two separate transactions (“Capital Gains Dividend” and “Reinvested Dividend”) and achieve the same result — correct?
For another example, if there was a plain/pure “Reinvested Dividend” of $0.10 per share in the CDS sheet we would see the amount as “Total Non Cash Distribution ($) Per Unit”=$0.10 and “Actual Amount of Eligible Dividend”=$0.10. Is that right?
Thank you!
J
As a follow up to my last comment, what is the purpose of tracking the capital gain amount in adjustedcostbase.ca? Since it is already reported on the T3, if you include it in adjustedcostbase.ca you’ll need to make sure you don’t report the same capital gains twice.
Thanks,
J
J,
That’s correct: any eligible dividends (or any other distribution types that aren’t return of capital and aren’t reinvested) do not affect ACB and thus do not need to be considered in ACB calculations.
The “Reinvested Capital Gains Distribution” results in both an increase in ACB as well as a capital gain for the amount inputted. Often phantom distributions are coupled with capital gains, but that is not always the case. If the phantom distribution is not entirely coupled with a capital gain, you may input these amounts separately as “Capital Gains Dividend” and “Reinvested Dividend” transactions. Even if the amounts are the same, there is no harm in separating them into two transactions.
If a distribution is in the form of Total Non Cash Distribution ($) Per Unit of $0.10 and Actual Amount of Eligible Dividend of $0.10, then you should only input a “Reinvested Dividend” transaction of $0.10 per unit.
You are correct that capital gains distributions do not necessarily need to be inputted into AdjustedCostBase.ca, as they should be accounted for on your T3. They do not affect ACB; they just result in a capital gain in the year of the distributions. This functionality is provided on AdjustedCostBase.ca for completeness so that there’s a way to see all of your capital gains.
I thought for sure this CDS tool included mutual funds, not just ETFs and other stock exchange-traded securities. Is there a separate tool for mutual funds?
Also, I thought for sure AdjustedCostBase.ca required a paid subscription, but I see that it’s free. Is there another, similar ACB tool I’m thinking of that costs money? Kudos to you for offering this tool and, hopefully, the ad revenue comes close to covering your website hosting costs. 😉
Cheers,
Doug
Doug,
I’m not aware of any central repository for tax information for open-ended/non-publicly traded mutual funds.
Although the basic service on AdjustedCostBase.ca is free, we also offer AdjustedCostBase.ca Premium for $49/year, which provides the following additional features:
– Streamlined import of tax information for Exchange Traded Funds (ETFs) and publicly traded Mutual Funds and Trusts
– Annual Capital Gains PDF Reports
– Import Transactions from a Spreadsheet
– Exchange Rate Lookup
– Up to 5 portfolios (instead of 2)
– Ad-free
Ah, that makes sense. I thought for sure that mutual funds would be included within this CDS tool, since it even says that it’s for mutual funds. Odd.
I was trying to reply to a question on an online message board about the historical tax treatment for distributions on an RBC money market fund. RBC Global Asset Management’s website, sadly, doesn’t even provide historical distributions let alone the tax treatment. 🙁
Thanks for clarifying about your premium service! What do you mean by “portfolios”? Do you mean accounts, such that if one had more than 2 non-registered accounts, they’d need to purchase the premium service?
The premium service I was thinking of, though, was ACB Tracking, which apparently auto-imports and calculates the distribution information from the publicly-available CDS website. Or does yours do that as well? If so, then your service is even more compelling as I think they charge a minimum of $85 for up to 10 lookups (not sure if lookups means “accounts” or “securities,” though).
Cheers,
Doug
Doug,
Yes, tax distribution breakdown info for open-ended/non-publicly traded mutual funds can be hard to find. I’ve found often it can’t even be found on the mutual fund’s web site.
Portfolios on AdjustedCostBase.ca allow you to track ACB separately for different individuals or corporations. Your ACB for separate personal holdings in different brokerage accounts should be calculated all together. For futher information, please see the following:
https://www.adjustedcostbase.ca/blog/the-portfolio-feature/
Yes, AdjustedCostBase.ca Premium does allow tax information for ETF’s and other publicly traded funds to be imported – which includes data for return of capital, reinvested/phantom distributions and capital gains distributions.
Hi,
I have a question about this:
> If the phantom distribution is not entirely coupled with a capital gain, you may input these amounts separately as “Capital Gains Dividend” and “Reinvested Dividend” transactions.
Any reason why “Reinvested Dividend” does not support per-share input rather than total?
It’s harder to actually split them up because of this.
Thanks,
J
J,
The reason for this is to avoid confusion between price per share paid for additional shares and reinvested distribution amount per share. As a result you will need to calculate the total amount yourself by multiplying the per share amount by the number of units owned at the time of the distribution. When using the streamlined import feature available to AdjustedCostBase.ca Premium subscribers, this will be handled automatically.
Hey,
Great website and explanations. I have a difficult question:
I have started self investing with RBC in 2017 and switched about a year and a half in to Questrade. I have only discovered your site at that time and since I want to keep the books from the beginning decided to go back to my RBC documents. However, they are not accessible.
My understanding is what I need for the ACB are the buys and sells with all the details (e.g. date, price, units, account type e.g. TFSA, RRSP, margin). If I can pull those out from my excel sheet would that work? Or just start as is with Questrade?
P,
Your current ACB for a given security will depend on the complete transaction history back until the last time your share balance for that security was zero.
So if you sold everything before transferring from RBC to Questrade then you would only need your Questrade history to calculate your current ACB. But otherwise you would need the transactions from RBC.
You do not need to track your ACB for anything held in TFSA or RRSP accounts.
Hello,
I use the Streamlined Import of Tax Information from CDS and it is a great feature which I have not found anywhere else, even in tools like Wealthica or Sharesight.
In order to match the number of decimal places (5) used in the Excel spreadsheets provided by CDS, would it be possible for you to increase the number of decimal places displayed on your site in the “Amount/Share” column from 4 to 5? This would make verifying data easier.
Also, I noticed that “Reinvested Cap. Gain Dist.” transactions imported from CDS show ‘-‘ in the “Shares” and “Amount/Share” columns. Would it be possible to display the values instead of ‘-‘?
Thanks,
Karim
Karim,
Thanks for your suggestions – we have implemented both of them.
Thank you! Very much appreciated.
Hello,
BROOKFIELD RENEWABLE PARTNERS L.P. (ticker: BEP.UN, CUSIP: G16258108) became available on CDS yesterday however does not appear to be available in the import tool on your site. Another security (which became available on CDS after the one above) was available in the import tool almost immediately, so I’m wondering if there’s an issue with BEP.UN. Is there an additional delay because BEP.UN is type T5013 instead of the more common T3 or T5?
Thanks,
Karim
Karim,
The data for Brookfield Renewable Partners LP is now available.
Hello,
In the example provided, the amount entered for the “Reinvested Capital Gain Distribution” is 0.11827 $/unit.
This value matches both the “Total Non Cash Distribution ($) Per Unit” (A) and “Capital Gain” (B) as shown on the CDS spreadsheet.
What value should be entered if (A) and (B) are not the same on the CDS spreadsheet?
MPG,
There is an example of that here:
https://www.adjustedcostbase.ca/blog/phantom-distributions-and-their-effect-on-adjusted-cost-base/
If the non-cash distribution is larger than the capital gain then you can input a Reinvested Capital Gains Distribution transaction for the amount of the capital gain and a Reinvested Dividend transaction for the different.
I the non-cash distribution is less than the capital gain then you can input a Reinvested Capital Gains Distribution for the amount of the non-cash distribution and a Capital Gains Dividend transaction for the difference.
Should funds such as “CIB839 CIBC Managed Growth Portfolio A – Global Equity Balanced” be available in adjustedcostbase’s premiums Streamlined Import of Tax Information?
Jeff,
Return of capital and phantom distribution data for mutual funds that aren’t publicly traded is not available. You would need to track down this information yourself and enter it manually. However, the ACB information that mutual fund companies provide you is more likely to be accurate, as many of the reasons described at <http://www.adjustedcostbase.ca/blog/can-you-rely-on-your-brokerage-for-calculating-adjusted-cost-base-and-capital-gains/> do not apply for this case. If you would like to obtain the tax breakdown information then I would suggest checking the mutual fund issuer’s web site or contacting them.
Hi, should the Evolve HISU.U Evolve US high interest savings ETF be available in the Streamlined import of tax info in Adjustedcostbase? I’ve searched but it doesn’t show up.
Jeff,
Canadian-domiciled funds trading in US$ can be added by request. The data for HISU.U is now available.
Hello, the BMO Equal Weight Banks Index ETF (ZEB / 055685101) and Horizons Equal Weight Banks Index ETF (HBNK / 440465102) both seek to replicate the same index (Solactive Equal Weight Canada Banks Index) according to their webpages. I manually obtained the T3/R16 distributions breakdown for 2023 for each ETF from the CDS website. I was expecting the breakdowns between the two ETFs to look very similar but that was not the case. Each of ZEB’s monthly distributions were roughly 93% eligible dividends + 7% return of capital. However, Each of HBNK’s monthly distributions were roughly 29% eligible dividends + 71% return of capital. How can 2 ETFs that track the same index have such different distribution profiles? In the case of HBNK, it seems unit holders are getting only a minor portion of the underlying banks’ actual dividends. Where are the rest of the dividends going?
Karim,
I’m not sure, but it may be related to the fact that HBNK was introduced in the middle of 2023. HBNK immediately started paying a monthly distribution, and it’s possible this distribution was greater than the dividends received by its holdings. Another explanation could be that the number of units outstanding increased over the course of the year.
Hello,
I have a question regarding the source of Foreign Non-Business Income and I will use iShares Core S&P/TSX Capped Composite Index ETF (Symbol: XIC) as an example. My T3 slip reports a value in Box 25 – Foreign Non-Business Income.
The information obtained from iShares website for XIC indicates US and/or Bermuda as potential sources of Foreign Non-Business Income; however, I could not find information that clearly identifies the source for the distributed Foreign Non-Business Income.
The tax breakdown from CDS Innovations has the question “Was there any U.S.-source income distributed in reporting tax year?” and the answer is YES.
Do I report the source as US for all of the reported Foreign Non-Business Income or is there a way to determine if any portion is from a Non-US source (in this case, Bermuda)?
Thank you.
Hi, I was looking at Global X S&P/TSX 60 Index Corporate Class ETF (symbol HXT, CUSIP 37963M108). There’s no tax slip for it on the CDS Innovations site for 2024. Is that because Corporate Class ETFs are not expected to pay distributions? What about phantom/reinvested distributions? Will AdjustedCostBase.ca’s tax import tool automatically tell me if there is a slip in a given year (if there happens to be a phantom distribution, for example)?
Karim,
HXT has not paid any distributions nor has it incurred any phantom distributions, which is why no data is available. When you search on AdjustedCostBase.ca you will still see the data available for import for each year, however, no transactions will be imported (going through the process will simply mark the process as completed).
For those finding this in 2026, the tax breakdown service has been moved to https://ctbsext.posttrade.cds.ca/ctbsExt/
Will the Streamlined Import still work for 2025 data? It appears that the CDS data is in PDF format for 2025 tax year.
Thanks, Ryan. The link above has been updated.
Karim: this change will not impact any functionality on AdjustedCostBase.ca.
It looks like the link to the breakdown service is once again broken, it’s been showing “The site is currently experiencing difficulties. Our support team is aware and investigating. We apologize for the inconvenience.” for at least a week or two. On the CDS/TMX front page seem to imply it is now a subscription-only service.
T,
The CDS tax reporting site was down last weekend as well and came back up last Monday. I would suggest checking back again tomorrow.
Thanks, Ryan, for the updated link to the Tax Breakdown Service, and to the website owner for updating the link in the blog post.
It appears, sadly, that TSX / CDS have decided to keep the 2024 and prior tax years available on the old site. Website owner, can we include a link to the old site for the archival data as well?
Doug,
Thanks for the suggestion. The link to the page for 2024 and earlier years has been added above.